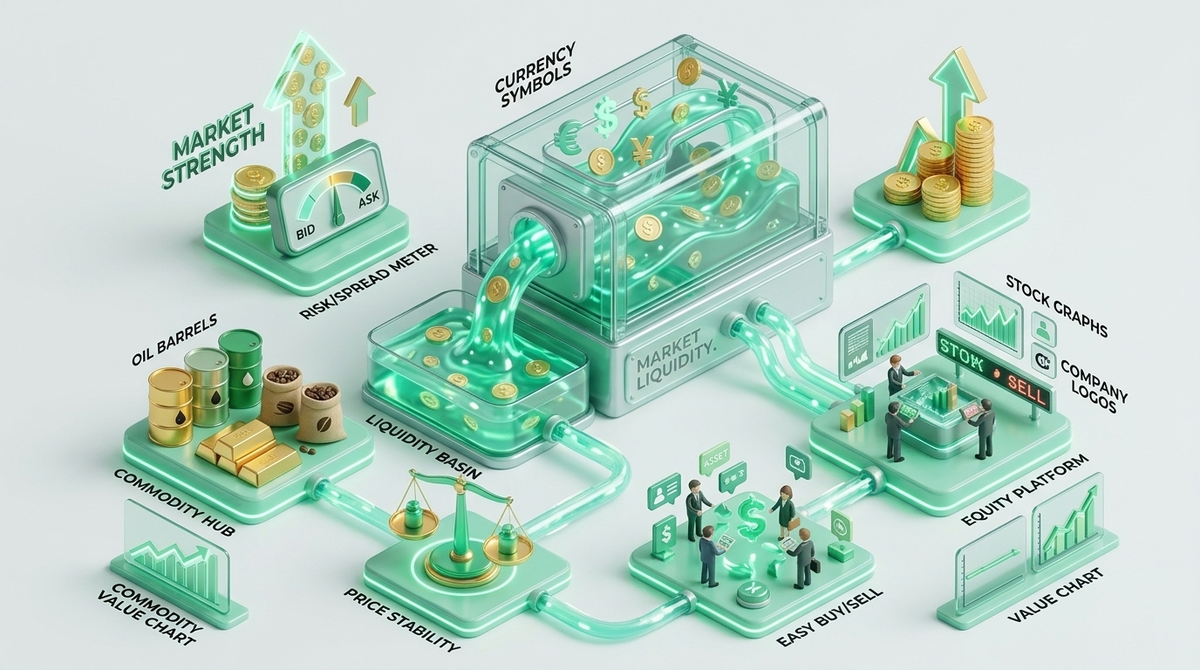
Market liquidity is the degree to which an asset can be bought or sold quickly without causing a major change in its price. High liquidity means many buyers and sellers are active, allowing for fast transactions at stable prices. This 2026 guide explains why this matters for your investment strategy.
Have you ever tried to sell something quickly without dropping the price? Market liquidity is the financial market’s equivalent of this challenge. It measures the ease of asset trading at a fair market value. This guide demystifies liquidity, explains its critical role in the 2026 financial landscape, and provides actionable insights for all investors.
What Is Market Liquidity at Its Core?

At its core, market liquidity is the ability to convert an asset into cash quickly without affecting its market price. A liquid asset, like a major stock, can be sold almost instantly. An illiquid asset, such as a rare painting, may take months or years to sell at its expected value.
The U.S. Securities and Exchange Commission (SEC) defines liquidity in terms of how easily an asset can be converted to cash. Think of the difference between selling 100 shares of Apple (AAPL) and selling a niche, collectible piece of art. You can sell the Apple shares in seconds at a predictable price because the market is highly liquid. Selling the art requires finding a specific buyer, a process that could take months and result in a price far from your initial expectation, making it highly illiquid. The two key components are the speed of the transaction and the minimal impact on the asset’s price. Market liquidity fundamentally reflects the ease with which an asset can be bought or sold at a stable, transparent price.
Defining Liquidity: The Ease of Buying and Selling Assets
A liquid market has a constant presence of willing buyers and sellers. This high number of market participants means you can execute a trade almost instantly. In contrast, an illiquid market has few participants. Finding a counterparty to your trade can take a long time, often forcing you to offer a significant price discount to attract a buyer. This discount is a form of liquidity premium for the buyer, compensating them for purchasing a less-desirable asset. It is important to know that liquidity exists on a spectrum; assets are not just liquid or illiquid but have varying degrees of liquidity, which can change based on market conditions.
The Two Sides of Liquidity: Market Depth and Tight Bid-Ask Spreads
Two primary indicators reveal a market’s liquidity: the bid-ask spread and market depth. Understanding both gives you a clearer picture of an asset’s tradability.
Bid-Ask Spread: The bid-ask spread is the difference between the highest price a buyer will pay for an asset (the bid) and the lowest price a seller will accept (the ask). A tight or narrow spread, often just pennies for a popular stock, is a hallmark of high liquidity. This small gap signifies strong agreement on the asset’s value and low transaction costs for traders.
Market Depth: Market depth refers to a market’s capacity to absorb large orders without a major price impact. It is visualized through an order book, which shows the volume of open buy and sell orders at different price levels. A deep market has a high volume of orders on both the buy and sell sides, preventing a single large trade from causing excessive slippage. Educational materials from NASDAQ on market technology explain how market makers contribute to this depth.
| Bid Volume | Bid Price | Ask Price | Ask Volume |
|---|---|---|---|
| 500 | $99.99 | $100.01 | 700 |
| 1200 | $99.98 | $100.02 | 950 |
| 2000 | $99.97 | $100.03 | 1500 |
Why Market Liquidity Is a Cornerstone of Healthy Financial Markets

Market liquidity is a cornerstone of healthy financial markets because it fosters investor confidence, ensures fair pricing, and reduces systemic risk. When investors trust they can enter and exit positions efficiently, they are more willing to participate, which fuels economic growth and stabilizes the entire financial system.
Liquidity is not just a feature; it is a prerequisite for a functional and fair market. It underpins the confidence of all market participants, from individual savers to large institutions. The overall stability of the financial system depends on it. Reports from organizations like the International Monetary Fund (IMF) on global financial stability consistently highlight that a breakdown in market liquidity can trigger or worsen financial crises. Why does liquidity matter so much for market health? It provides several key benefits. A high degree of market liquidity directly supports financial stability by promoting efficient price discovery and reducing transaction costs.
Benefit 1: Fosters Price Stability and Reduces Volatility
In a liquid market, a single large trade is easily absorbed by a vast pool of buyers and sellers, resulting in only minor price fluctuations. The high volume of participants acts as a buffer. In contrast, an illiquid market is prone to high volatility. The same large order in an illiquid market could exhaust all available interest at the current price, causing a dramatic price swing as it moves to find the next available counterparty.
Benefit 2: Enables Efficient Price Discovery
Efficient price discovery is the process where a market determines an asset’s true or fair value through the interactions of buyers and sellers. High liquidity is essential for this process. With millions of transactions and participants constantly reacting to new information, a liquid market rapidly reaches a more accurate and widely accepted market consensus on an asset’s price. This concept is a central tenet of the Efficient Market Hypothesis (EMH).
Benefit 3: Lowers Transaction Costs for Investors
Lower transaction costs are a direct result of high liquidity. The primary implicit cost for any trader is the bid-ask spread. In a liquid market, competition among buyers and sellers narrows this spread. A smaller spread means you lose less money on the round trip trade of buying and then selling an asset, improving your potential returns.
Benefit 4: Attracts More Market Participants
Liquidity creates a positive feedback loop. Investors, particularly large institutional investors, are attracted to liquid markets because they have confidence they can enter and exit large positions without difficulty. This influx of new market participants and capital, in turn, increases the market’s liquidity even further, reinforcing the cycle and strengthening the market.
How to Measure and Assess Market Liquidity in 2026

In 2026, you can measure market liquidity using three key metrics available on most trading platforms: the bid-ask spread, market depth, and trading volume. A tight bid-ask spread, deep order book, and high trading volume all indicate that an asset is highly liquid and easy to trade.
For investors, understanding how to assess an asset’s liquidity is a practical skill. In 2026, these liquidity metrics are readily available on most advanced trading platforms and from financial data providers. Analyzing them helps you gauge transaction costs and potential execution risks before you place a trade. Investors can assess an asset’s liquidity by analyzing its bid-ask spread, order book depth, and average daily trading volume.
Key Metric 1: The Bid-Ask Spread
The bid-ask spread is the most direct measure of liquidity. The formula is simple: Spread = Ask Price – Bid Price. For example, if a stock’s bid price is $100.00 and its ask price is $100.05, the spread is $0.05. For a $100 stock, this represents a percentage spread of just 0.05%, which is considered very tight and indicative of high liquidity. A wide spread suggests fewer participants and lower liquidity.
Key Metric 2: Market Depth and Order Book Analysis
A deep dive into the order book provides a more advanced view of liquidity. It is not just the best bid and ask that matter, but the volume of orders at prices below the bid and above the ask. A “deep” market has substantial volume at these subsequent price levels, often called “buy walls” and “sell walls.” A market depth chart visually represents this, showing that the market can handle large orders without the price moving too much.
Key Metric 3: Trading Volume and Turnover Ratio
Two related metrics that measure market activity are trading volume and turnover ratio.
- Trading Volume: This is the total number of shares or contracts traded in a given period, such as a day. Higher average daily volume generally indicates higher liquidity. Data for any public company is available on sites like Yahoo Finance.
- Turnover Ratio: This is a more advanced liquidity ratio calculated as: Volume / Shares Outstanding. It shows what percentage of a company’s total available shares are traded over a period. A high turnover ratio indicates strong investor interest and high liquidity.
The Primary Drivers Influencing Market Liquidity

The primary drivers of market liquidity are economic conditions, monetary policy, market structure, and technology. A strong economy and accommodative central bank policies tend to increase liquidity, while regulations and algorithmic trading can have more complex effects, sometimes boosting and sometimes reducing it.
Market liquidity is not a static property; it changes constantly. It is influenced by a combination of macroeconomic forces, structural market design, and technological advancements. Understanding these drivers helps you anticipate shifts in market conditions. Market liquidity is primarily driven by macroeconomic factors, central bank monetary policy, and the underlying structure of the market.
Economic Conditions and Monetary Policy
Strong economic growth generally boosts investor confidence and risk appetite, leading to higher trading activity and increased liquidity. Conversely, a recession can cause investors to pull back, reducing liquidity. More directly, monetary policy from central banks like the Federal Reserve (Fed) or the European Central Bank (ECB) is a major driver. Actions like lowering interest rates or implementing quantitative easing (QE) inject cash into the financial system, directly boosting liquidity.
The Role of Technology and High-Frequency Trading (HFT)
Technology has transformed market liquidity. Algorithmic trading and High-Frequency Trading (HFT), where computers execute millions of orders per second, have massively increased liquidity in many markets by providing constant quoting and tightening bid-ask spreads. However, there is a downside. Some studies, including analysis following “flash crashes,” suggest that HFT algorithms can sometimes withdraw all their orders simultaneously during times of stress, creating “phantom liquidity” that vanishes when it is most needed.
Market Structure and Regulation
The rules governing a market have a direct impact on its liquidity. Regulations like MiFID II in Europe and Reg NMS in the US were designed to increase transparency and competition among trading venues, which can affect liquidity flows. The obligations placed on official market makers, who are required to provide continuous buy and sell quotes, are a foundational part of market structure designed to ensure a baseline level of liquidity. The existence of dark pools, private trading venues, also impacts liquidity in public markets.
The Real-World Impact: Liquid vs. Illiquid Markets

The real-world impact of liquidity is seen in transaction costs, speed, and risk. Liquid markets, like major stocks, offer low costs and fast execution. Illiquid markets, such as real estate, involve high costs and long transaction times, presenting different risks and opportunities for investors.
The difference between liquid and illiquid markets has direct consequences for your investment strategy. How do I choose between liquid and illiquid assets? Your choice should depend on your time horizon, risk tolerance, and financial goals. A day trader has very different liquidity needs than a pension fund. Liquid markets are characterized by low transaction costs and high price stability, whereas illiquid markets typically have high costs and greater price volatility.
| Characteristic | Liquid Market (e.g., S&P 500 Stocks) | Illiquid Market (e.g., Fine Art) |
|---|---|---|
| Transaction Speed | Seconds | Months or Years |
| Transaction Cost | Low (tight bid-ask spread) | High (commissions, fees, discounts) |
| Price Stability | High | Low (volatile) |
| Risk | Lower execution risk | Higher execution risk; difficult to exit |
For Day Traders and Short-Term Investors
Liquidity is the lifeblood of a day trader. Strategies like scalping and other forms of day trading depend on entering and exiting dozens or hundreds of positions in a single day. This requires near-instant execution speed and minimal costs. Tight spreads and deep markets are non-negotiable. For these short-term investors, illiquid assets are completely unsuitable, as the high transaction costs and potential for slippage would erase any potential profits.
For Long-Term Investors and Pension Funds
For long-term investors following a buy and hold strategy, immediate liquidity is less of a concern. These investors, including large pension funds, may intentionally allocate a portion of their portfolio to illiquid assets like private equity, infrastructure, or real estate. They do this to capture a potential “illiquidity premium“—the prospect of higher returns as compensation for tying up their capital for many years. Data from firms like Cambridge Associates often shows private equity outperforming public equity over long time horizons, partly due to this premium.
Examples of Highly Liquid Markets
The following are examples of markets known for high liquidity:
- Foreign Exchange (Forex) Market: Major currency pairs like the EUR/USD, USD/JPY, and GBP/USD are traded in volumes exceeding trillions of dollars daily.
- Major Stock Indices: Stocks included in the S&P 500 or the FTSE 100 have millions of shares traded daily.
- Government Bonds: Debt issued by stable governments, especially U.S. Treasuries, is considered a benchmark for liquidity.
- Major Commodities: Assets like crude oil (WTI, Brent) and gold have deep, global markets with constant trading activity.
Examples of Typically Illiquid Markets
The following are examples of asset classes known for being illiquid:
- Real Estate: Property sales involve high transaction costs, lengthy legal processes, and can take months to complete.
- Private Equity and Venture Capital: Investments in private companies require capital to be locked up for 5-10 years or more.
- Fine Art and Collectibles: This is a niche market with high dealer fees, subjective valuation, and a small pool of potential buyers.
- Penny Stocks and Micro-Cap Stocks: These small company stocks often have very low trading volume, making it difficult to buy or sell without affecting the price.
The Dangers of Illiquidity: Understanding and Mitigating Risks
The primary dangers of illiquidity are high transaction costs from slippage and the risk of being unable to sell an asset during a market downturn. A sudden evaporation of liquidity can cause a “flash crash” or, in extreme cases, a systemic liquidity crisis that freezes entire markets.
While illiquid assets can offer higher returns, they come with significant dangers. Understanding and planning for these risks is a key part of responsible portfolio construction and risk management. An unexpected need for cash can turn an illiquid investment into a major financial problem. Illiquidity risk exposes investors to the danger of being unable to sell an asset at a fair price when needed.
Slippage and Higher Execution Costs
Slippage is the difference between the price you expect for a trade and the price at which it is actually executed. In illiquid markets, placing a large market order can quickly exhaust the available shares at the best price, forcing your order to be filled at progressively worse prices. This “eating through the order book” results in a poor average execution price and acts as a major hidden cost.
The Risk of “Flash Crashes” and Liquidity Crises
A flash crash occurs when liquidity suddenly disappears, causing prices to plummet on very low volume before often recovering just as quickly. The 2010 “Flash Crash” is a well-documented example. On a broader scale, a liquidity crisis can freeze entire markets. The 2008 financial crisis was a prime example of this systemic risk. Markets for certain mortgage-backed securities became completely illiquid—there were no buyers at any reasonable price—leading to a cascade of failures across the financial system. Both the Bank for International Settlements (BIS) and the IMF have published extensive analyses on this topic.
Strategies for Investing in Illiquid Assets
If you choose to invest in illiquid assets, you can mitigate the risks with the following strategies:
- Position Sizing: Keep your allocation to any single illiquid asset small relative to your total portfolio.
- Long Time Horizon: Only invest capital that you are certain you will not need for many years.
- Diversification: Spread your investments across different types of illiquid assets to avoid concentration risk.
- Use Limit Orders: When trading less liquid securities, always use limit orders instead of market orders. This protects you from severe slippage by specifying the maximum price you will pay or the minimum price you will accept.
The Future of Market Liquidity: Trends to Watch in 2026 and Beyond
The future of market liquidity is being shaped by financial technology (FinTech), particularly decentralized finance (DeFi) and artificial intelligence (AI). In 2026, trends like asset tokenization, AI-driven trading, and Central Bank Digital Currencies (CBDCs) are set to redefine how liquidity is created and managed.
The landscape of liquidity is in a state of constant evolution, driven by powerful technological and financial paradigm shifts. As an investor, staying aware of these 2026 trends is key to understanding the future of market evolution. Forward-looking reports from major consulting firms on FinTech trends highlight several key areas of change. By 2026, the tokenization of real-world assets is projected to introduce trillions of dollars in new liquidity to global markets.
The Rise of Decentralized Finance (DeFi) and Tokenization
Two innovations from the world of Decentralized Finance (DeFi) are poised to transform liquidity. First, tokenization is the process of creating a digital token on a blockchain to represent a real-world asset. This could make traditionally illiquid assets like a commercial building or a piece of art divisible and tradable 24/7 on global markets. Projections from Deloitte for 2026 indicate that tokenized real-world assets could add over $5 trillion in new liquidity to global markets. Second, DeFi protocols use Automated Market Makers (AMMs), which are smart contracts that create liquidity pools of tokens. This provides a new, algorithm-based model for providing liquidity that is distinct from traditional order books, though it comes with its own risks like impermanent loss.
AI-Powered Liquidity Provision and Risk Management
Artificial Intelligence (AI) and Machine Learning are making algorithmic execution far more sophisticated. AI-powered systems can now perform predictive analytics to forecast short-term liquidity fluctuations and optimize how large trades are executed to minimize market impact. These algorithms can break up a large order and place smaller pieces across different venues over time. AI is also enhancing risk modeling, giving institutions a better ability to forecast and stress-test their portfolios against potential liquidity crises.
The Evolving Role of Central Banks as Liquidity Providers
Central banks will continue their role as the lender of last resort, but their tools may evolve. A major trend to watch is the development of Central Bank Digital Currencies (CBDCs). Research from institutions like the Bank for International Settlements (BIS) shows dozens of central banks are exploring CBDCs. A fully implemented CBDC could fundamentally alter payment systems and the interbank market, potentially creating new and more efficient channels for managing liquidity across the entire economy.
— Your Guide to Understanding Market Liquidity —
Now that we have covered the core concepts, drivers, and future of market liquidity, let’s answer some common questions that investors often have. This section provides clear answers to help solidify your understanding.
Frequently Asked Questions About Market Liquidity
Here are clear, concise answers to some of the most frequently asked questions about market liquidity.
What Is A Liquidity Trap?
A liquidity trap is a macroeconomic situation where central bank monetary policy becomes ineffective. This occurs when interest rates are near zero and savings rates are high. In this state, injecting more cash (liquidity) into the economy fails to stimulate spending or investment because people and businesses choose to hoard cash, expecting deflation or insufficient demand. This concept is closely associated with Keynesian economics.
Is High Market Liquidity Always a Good Thing?
No, but it is generally beneficial. While high liquidity is a feature of healthy markets, excessively high liquidity, often fueled by speculation and cheap credit, can contribute to the formation of asset bubbles. When market sentiment eventually turns negative, this “hot money” can vanish almost instantly. This sudden evaporation of buyers can lead to a liquidity-driven crash, as seen in various financial crises.
What Are The Main Types Of Liquidity in Finance?
There are three main types of liquidity in finance, each describing a different aspect of financial health.
- Market Liquidity: The ease with which an asset can be bought or sold on the market without affecting its price, as discussed throughout this article.
- Accounting Liquidity: A company’s ability to meet its short-term debt obligations using its current assets, such as cash, marketable securities, and accounts receivable. It is measured by financial metrics like the current ratio.
- Funding Liquidity: An institution’s ability to raise the cash needed to meet its obligations. This can be achieved by borrowing from the interbank market, issuing new debt, or selling assets.
Market Liquidity vs. Solvency: What’s The Difference?
Liquidity is a measure of short-term cash flow, while solvency is a measure of long-term financial health. A company is liquid if it has enough cash to pay its immediate bills, like payroll and suppliers. A company is solvent if its total assets exceed its total liabilities. An analogy helps explain the difference: a profitable, well-run company (solvent) can still face bankruptcy if it runs out of cash to pay its bills (illiquid). Conversely, a company with lots of cash (liquid) can still be insolvent if its long-term debts are greater than its total assets.
Key Takeaways: Navigating Market Liquidity for Smarter Investing in 2026
Understanding market liquidity moves you from being a passive market observer to an informed investor. It is a fundamental concept that touches every aspect of trading and portfolio management. Liquidity is about the speed and price stability of your transactions, it is vital for overall market health, and it is a measurable factor you can analyze before making an investment.
To apply this knowledge for smarter investing, remember these key points:
- Always assess an asset’s liquidity before investing by checking its bid-ask spread, volume, and market depth.
- Match the asset’s liquidity profile to your personal investment horizon and risk tolerance.
- Use limit orders, especially in less liquid markets, to protect yourself from slippage and control your execution price.
- Stay aware of macroeconomic and technological trends, such as DeFi and AI, that will continue to shape the future of market liquidity.